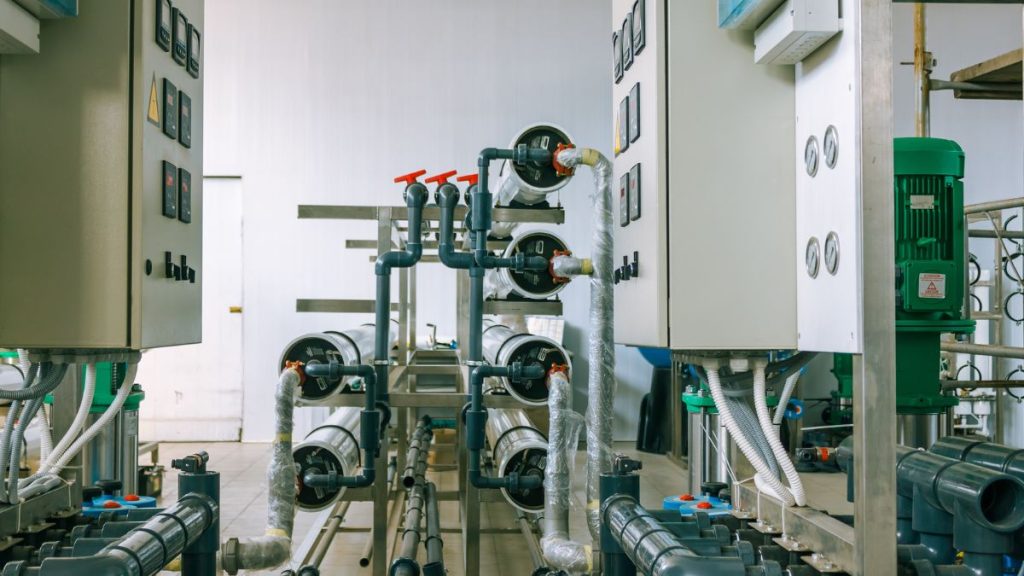
A well-executed RO performance monitoring program enables facilities to identify developing membrane and system issues long before they result in costly failures. Reverse osmosis (RO) systems rarely experience sudden performance loss without warning. Instead, subtle changes in operating parameters such as permeate flow, conductivity, pressure, recovery, and salt rejection typically occur days or even weeks before production capacity declines or water quality falls outside specification.
While most industrial facilities routinely collect operating data, many struggle to interpret what those numbers actually indicate. Looking at individual readings in isolation often fails to reveal the underlying cause of declining performance.
By understanding how key performance indicators relate to one another, operators can detect fouling, scaling, membrane degradation, or mechanical issues early, allowing maintenance to be planned before they affect operations.
Why RO Performance Monitoring Is Essential
Many facilities only begin investigating their RO system after they experience noticeable operational problems, such as:
- Reduced permeate production
- Product water that no longer meets quality specifications
- Increased energy consumption
- More frequent chemical cleaning
- Premature membrane replacement
At this stage, the root cause has often progressed significantly, resulting in higher operating costs and unplanned downtime.
A proactive RO performance monitoring strategy enables operators to:
- Detect membrane fouling before severe performance loss occurs
- Differentiate between scaling, fouling, and membrane damage
- Optimize cleaning intervals
- Maintain consistent water quality
- Reduce operational costs
- Extend membrane service life
Rather than reacting to failures, facilities can make informed maintenance decisions based on measurable performance trends.
The Key Parameters Every RO Operator Should Monitor
Effective RO performance monitoring requires evaluating multiple operating parameters together rather than relying on individual measurements. A single reading rarely provides sufficient information to determine the condition of an RO system. However, when several parameters are analyzed collectively and tracked over time, they can provide valuable insight into membrane health, process efficiency, and developing operational issues.
The following performance indicators should be monitored regularly.
1. Permeate Flow
Permeate flow represents the volume of purified water produced by the RO system over a given period.
Normal operating condition
A stable permeate flow generally indicates that the membrane is operating close to its design capacity under consistent feed water conditions.
What a declining permeate flow indicates
A gradual reduction in permeate flow commonly suggests:
- Membrane fouling
- Scale formation
- Biological fouling
- Feed channel blockage
A sudden decrease in permeate production may instead indicate:
- Feed pump malfunction
- Feed pressure loss
- Valve failure
- Instrumentation issues
Permeate flow should never be evaluated independently. It should always be interpreted alongside operating pressure and conductivity to determine the most likely cause.
2. Recovery Rate
Recovery rate is the percentage of feed water converted into permeate.
For example, if an RO system receives 100 m³/hour of feed water and produces 75 m³/hour of permeate, the recovery rate is 75%.
Why recovery matters
Operating above the designed recovery increases the concentration of dissolved minerals within the membrane system.
As concentration increases, so does the likelihood of:
- Mineral scaling
- Higher osmotic pressure
- Reduced membrane efficiency
- Accelerated membrane wear
Unexpected changes in recovery without operational adjustments should be investigated promptly, as they may indicate process instability or instrumentation errors.
3. Salt Rejection
Salt rejection measures the membrane’s ability to remove dissolved salts from feed water.
High and consistent salt rejection is one of the primary indicators of a healthy RO membrane.
Declining salt rejection may indicate
- Membrane aging
- Chemical degradation
- Oxidation damage
- Mechanical damage
- Damaged seals or O-rings
- Improper membrane installation
Even a relatively small reduction in salt rejection can significantly impact water quality, particularly in industries where product water specifications are tightly controlled.
4. Permeate Conductivity
Conductivity measures the concentration of dissolved ions that remain in the permeate after treatment.
An increase in permeate conductivity generally indicates that more dissolved contaminants are passing through the membrane.
Rising conductivity may indicate
- Declining membrane integrity
- Reduced salt rejection
- Membrane damage
- Seal leakage
- Changes in feed water quality
Because conductivity responds quickly to membrane performance changes, it is one of the most valuable indicators in any RO performance monitoring program.
5. Operating Pressure
Feed pressure provides the driving force required for the reverse osmosis process.
Increasing operating pressure
If the system requires progressively higher pressure to maintain the same permeate production, membrane fouling or scaling is likely developing.
This typically results in:
- Higher energy consumption
- Increased pump loading
- Reduced operating efficiency
- Higher operating costs
Decreasing operating pressure
Unexpected pressure loss may indicate:
- Feed pump performance issues
- Feed supply interruptions
- Mechanical leakage
- Pressure sensor inaccuracies
Pressure data should always be evaluated together with permeate flow to determine whether declining performance is caused by hydraulic or membrane-related issues.
6. Differential Pressure
Differential pressure (ΔP) measures the pressure drop across each membrane stage.
It is one of the earliest indicators of feed channel fouling and should be monitored consistently throughout system operation.
Increasing differential pressure often indicates
- Particulate fouling
- Biological fouling
- Scale accumulation
- Blocked feed spacers
If differential pressure continues to increase without corrective action, facilities may experience:
- Reduced permeate production
- More frequent chemical cleaning
- Higher operating costs
- Permanent membrane damage
Monitoring differential pressure trends enables operators to schedule cleaning before severe fouling affects system performance.
Read Also: Process Water Treatment Solutions for Reliable Industrial Operations
Why Performance Trends Matter More Than Individual Readings
One operating parameter rarely provides enough information to accurately diagnose an RO system.
For example, a slight increase in conductivity may not immediately indicate membrane failure. Likewise, a reduction in permeate flow alone does not necessarily confirm fouling.
However, when multiple parameters begin changing together, a clear pattern often emerges.
| Performance Indicator | Typical Trend | Possible Cause |
| Permeate Flow | Gradually decreasing | Fouling or scaling |
| Operating Pressure | Gradually increasing | Fouling or scaling |
| Differential Pressure | Increasing | Feed channel blockage |
| Conductivity | Increasing | Membrane degradation or leakage |
| Salt Rejection | Decreasing | Membrane damage or aging |
Trend analysis enables operators to identify developing problems before production is affected or emergency maintenance becomes necessary.
Recognizing Common RO Performance Patterns
Pattern 1: Membrane Fouling
Typical indicators include:
- Declining permeate flow
- Increasing operating pressure
- Increasing differential pressure
- Stable salt rejection during the early stages
Recommended action
Inspect pretreatment performance and evaluate whether membrane cleaning should be scheduled.
Pattern 2: Mineral Scaling
Typical indicators include:
- Declining permeate flow
- Increasing operating pressure
- High recovery operation
- Stable conductivity during the early stages
Recommended action
Review feed water chemistry, antiscalant dosage, and system recovery settings.
Pattern 3: Membrane Degradation
Typical indicators include:
- Increasing permeate conductivity
- Declining salt rejection
- Relatively stable permeate flow during the initial stage
Recommended action
Inspect membrane integrity, investigate potential chemical exposure, and determine whether membrane replacement is necessary.
Best Practices for Effective RO Performance Monitoring
An effective monitoring program is built on consistency rather than reacting only when alarms occur.
Facilities should adopt the following practices:
- Record operating parameters consistently.
- Analyze performance trends rather than isolated readings.
- Normalize performance data when feed water temperature changes significantly.
- Verify instrument calibration regularly.
- Investigate gradual performance changes before operational limits are exceeded.
- Combine operational data with routine water quality analysis.
A structured monitoring program supports more informed maintenance decisions, improves system reliability, and reduces the likelihood of unexpected downtime.
Read Also: Type of Membrane Fouling and How to Prevent It in Water Treatment Systems
Supporting Better RO Performance Through Expert Monitoring
Interpreting RO performance data requires more than reviewing daily operating logs. Accurate diagnosis depends on understanding how multiple performance indicators interact under varying operating conditions.
Lautan Air Indonesia (LAI) supports industrial customers with comprehensive water treatment expertise, including water quality analysis, RO system evaluation, membrane performance assessment, operational optimization, and customized treatment programs. By combining field experience with technical analysis, LAI helps facilities identify performance issues early and implement solutions that improve system reliability and long-term operating efficiency.
Whether optimizing an existing RO system or investigating declining performance, a data-driven approach enables more effective operational decisions and sustainable system performance.
Improve Your RO System Performance Before Problems Escalate
Small changes in RO operating data often provide the earliest indication of developing system issues. Acting on these trends before they become failures can reduce maintenance costs, extend membrane life, and maintain consistent water quality.
If your facility is looking to strengthen its RO performance monitoring program or address declining RO performance, contact Lautan Air Indonesia to discuss how our technical experts can help optimize your water treatment system through practical, data-driven solutions.