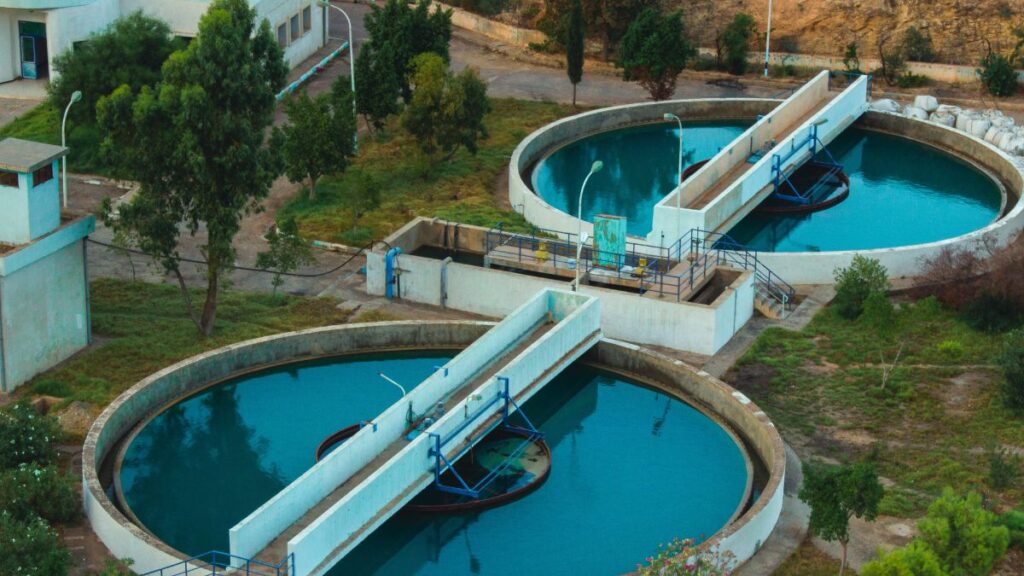
Clarifier performance indicators provide operators with practical insight into how well a clarification process is performing under actual operating conditions. A clarifier can appear to be operating normally while hydraulic loading, sludge accumulation, settling behavior, or flow changes are already affecting separation performance.
For this reason, operators should monitor more than final effluent turbidity alone. Surface overflow rate (SOR), overflow rate, sludge blanket level, turbidity, and flow variation can help identify early signs of hydraulic stress, solids accumulation, and unstable clarification.
Why Clarifier Performance Indicators Matter
Clarification depends on effective solid-liquid separation. Suspended solids or flocs need suitable conditions to settle while clarified water moves toward the outlet. Changes in hydraulic loading, solids loading, settling characteristics, or sludge removal can disrupt this balance.
Research has shown that SOR can affect effluent suspended solids, while sludge blanket behavior is influenced by solids loading, recycle flow, and flow distribution.
Monitoring these indicators together helps operators answer three questions:
- Is the clarifier receiving an appropriate hydraulic load?
- Are solids settling and being removed effectively?
- Is the clarifier consistently producing the required effluent quality?
1. Surface Overflow Rate (SOR)
Surface overflow rate describes the hydraulic loading applied to the clarifier surface.
SOR = Flow Rate / Clarifier Surface Area
It is commonly expressed in m³/m²·day.
As flow increases, the upward movement of water through the clarification zone also increases. If hydraulic conditions become unfavorable relative to the settling characteristics of the solids, particles may remain suspended or be carried toward the outlet.
Studies have shown that clarifier performance and effluent suspended solids can be affected by SOR and floc characteristics.
What operators should monitor
Compare actual SOR with the clarifier’s design basis and historical operating range, particularly when:
- Flow increases significantly
- One clarifier is taken offline
- Parallel clarifiers receive uneven flow
- Effluent turbidity or TSS begins increasing
- Peak production or wet-weather flow occurs
Read Also: Clarifier in the Water Industry: Function, Types, and Applications
2. Overflow Rate
Overflow rate is another useful hydraulic indicator. Depending on the application, operators may also evaluate weir overflow rate to understand loading at the clarifier outlet.
The key concern is not simply the calculated value, but whether the clarifier is handling and distributing the incoming flow effectively.
Uneven and time-varying flow distribution can affect sludge blanket behavior and clarifier stability. Recent research has also shown that good flow distribution and high-quality process data are important for predicting sludge blanket behavior.
What operators should monitor
Review:
- Average and peak flow
- Flow distribution between clarifiers
- Weir loading where applicable
- Flow changes during production
- Sudden hydraulic surges
Differences between parallel clarifiers can also indicate uneven flow distribution or unit-specific problems.
3. Sludge Blanket Level
Sludge blanket level indicates the depth of accumulated solids within the clarifier.
A rising blanket can mean that solids are entering faster than they are being removed, or that settling performance has deteriorated. Operating with an excessively deep sludge blanket can increase the risk of solids escaping through the overflow, particularly during peak flow conditions.
What operators should monitor
Monitor sludge blanket trends and evaluate them alongside:
- MLSS
- SVI
- RAS and WAS flow
- Settling characteristics
- Hydraulic loading
An increasing blanket should not automatically lead to increased sludge withdrawal. Operators should first determine whether the cause is poor settling, excessive solids loading, hydraulic stress, or insufficient removal.
Read Also: Sludge Blanket: How to Control It for Stable and Efficient Water Treatment
4. Turbidity
Turbidity is one of the most practical indicators of clarification performance.
Increasing outlet turbidity means more particles are remaining in the clarified water. Possible causes include poor floc formation, insufficient settling, hydraulic disturbance, sludge carryover, or changes in incoming water characteristics.
Turbidity should be interpreted together with other indicators. For example, increasing turbidity alongside a rising sludge blanket may indicate solids accumulation, while a sudden turbidity increase during a flow surge may point toward hydraulic stress.
What operators should monitor
Useful measurements include:
- Inlet and outlet turbidity
- Turbidity removal
- Turbidity trends
- Turbidity during peak flow
- Changes after chemical dosage adjustments
- Differences between parallel clarifiers
5. Flow Variation
Flow variation is often overlooked when investigating clarifier problems.
A clarifier may perform well at stable flow but respond differently when flow changes rapidly. Sudden increases can raise hydraulic loading and affect solids movement within the tank.
This is particularly relevant to industrial facilities where wastewater generation changes with production schedules, batch operations, cleaning activities, or process interruptions.
Research has demonstrated that changing flow distribution can affect sludge blanket behavior and that well-controlled hydraulic conditions support more stable clarifier performance.
What operators should monitor
Look beyond average daily flow and review:
- Hourly flow profile
- Peak-to-average flow ratio
- Production-related flow peaks
- Flow changes after equalization
- Flow distribution between clarifiers
- Relationship between flow and turbidity
- Relationship between flow and sludge blanket level
How to Read These Indicators Together
Individual indicators rarely provide a complete diagnosis.
| Observation | Possible indication |
| High SOR + increasing turbidity | Hydraulic loading affecting separation |
| Rising sludge blanket + increasing turbidity | Solids accumulation or withdrawal issue |
| Stable SOR + rising turbidity | Settling, floc quality, or chemical treatment issue |
| Flow increase + turbidity spike | Hydraulic disturbance |
| Rising blanket + stable flow | Settling or sludge removal issue |
| Different performance between clarifiers | Uneven flow distribution or unit-specific issue |
These combinations are not definitive diagnoses. They are starting points for troubleshooting.
From Monitoring to Corrective Action
When clarifier performance changes, operators can follow a simple sequence:
1. Check hydraulic conditions. Review flow, SOR, overflow rate, and flow distribution.
2. Check solids behavior. Review sludge blanket, MLSS, SVI, and sludge withdrawal.
3. Check effluent quality. Compare inlet and outlet turbidity and TSS trends.
4. Check chemical treatment. Review dosage and process conditions, particularly when water characteristics have changed.
5. Check equipment. Inspect sludge collection, withdrawal systems, inlet distribution, weirs, and pumps.
This approach helps prevent operators from treating the symptom without addressing the underlying cause.
Supporting Clarifier Performance Through Process Evaluation
Improving clarification does not always require major equipment changes. In many cases, better performance starts with understanding the relationship between water characteristics, hydraulic conditions, chemical treatment, sludge behavior, and operating practices.
Lautan Air Indonesia can support this type of evaluation through its broader water treatment capabilities, including water treatment chemicals, process solutions, operation and maintenance support, laboratory services, and equipment solutions.
For facilities experiencing unstable turbidity, increasing sludge blanket levels, changing flow conditions, or inconsistent clarification results, a broader assessment can help identify whether the issue is primarily hydraulic, chemical, mechanical, or operational.
Read Also: Poor Effluent Quality in Clarifier Tanks: Identifying and Resolving Flow Rate Issues
Monitor the Right Indicators Before Performance Declines
Effective clarifier operation starts with understanding what is happening inside the process, not only checking the final effluent result.
By consistently monitoring clarifier performance indicators such as SOR, overflow rate, sludge blanket level, turbidity, and flow variation, operators can identify changes earlier and make better operational decisions.
If your clarification process is experiencing unstable turbidity, sludge accumulation, changing hydraulic loads, or inconsistent treatment results, Lautan Air Indonesia can help evaluate the treatment process and identify practical opportunities for improvement.
Talk to Lautan Air Indonesia about your water treatment and clarification challenges.
Reference
- Bakiri, Z., & Nacef, S. (2022). A mathematical model to predict the performance of the secondary clarifier of a municipal wastewater treatment plants. Journal of Water Process Engineering, 49, 103106.
- Koken, E. H., et al. (2024). Effects of using a specially designed sludge draw-off pipe for circular secondary clarifiers to mitigate underflow short-circuiting. CLEAN: Soil, Air, Water.
- Vetter, P. B., Stentoft, P. A., Munk-Nielsen, T., Madsen, H., & Møller, J. K. (2024). Toward smart wastewater treatment plants: a novel data-driven sludge blanket model based on stochastic differential equations. Water Science & Technology, 90(5), 1397-1415.
- Lee, et al. (2022). Comparison of Effluent Suspended Solid Concentrations from Two Types of Rectangular Secondary Clarifiers. Water, 14(10), 1577.
- Srivastava, S., Brighu, U., & Gupta, A. B. (2021). Performance assessment of pulsating floc blanket clarifiers and conventional clariflocculators in pilot-scale models. Water Environment Research, 93, 887-895.
- Pilot-scale coagulation of organic and inorganic impurities: Mechanisms, role of particle concentration and scale effects. Journal of Environmental Chemical Engineering, 8(4), 103990 (2020).